Avaya Messaging allows you to generate a variety of reports on key areas of the system, such as calls per hour by PBX and company, port usage and mailbox usage. These reports help you adjust server load and performance to ensure maximum productivity.
1.In order to use Web Reports, you must first enable data collection in the Messaging Admin console.
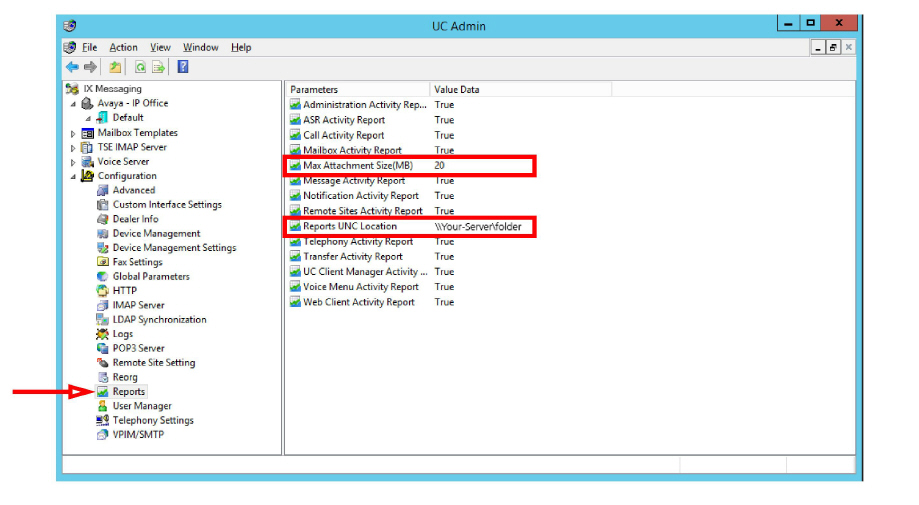
Go to Reports. In the right-hand pane, set to True all of the report parameters you expect to need.
Double-click Max Attachment Size(MB) and set the largest email that your want to pass through your mail servers.
For Reports UNC Location, specify the path where report files larger than the Max Attachment Size will be stored. The location can be on the local machine, somewhere else on the network, or an external server reachable through an Internet connection.
When generating Web Reports, you can view the results on your monitor, or have them sent out as an email.
If you choose to send the reports as email:
•If the file size is less than the Max Attachment Size, the report will be emailed directly to you.
•If the file size exceeds the Max Attachment Size, the file will be saved to the UNC location specified. An email notification will be sent to you that the file was created. Go to that location to recover the report file.
This prevents larger reports from being blocked by or severely taxing your email server.
Both settings are required before Web Reports can return any data.
|
Hint: By default, no report data is collected unless these settings are enabled. Any information on traffic before these settings were changed is lost. |
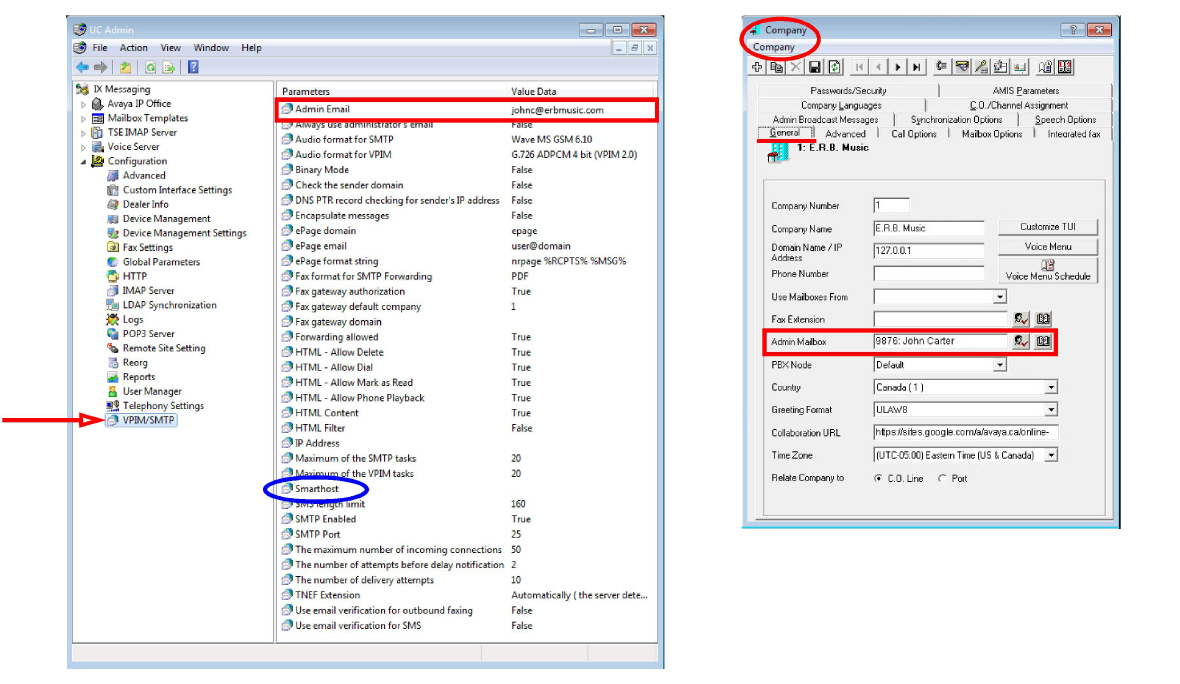
2.If you have not already done so, an administrator email must be setup on the system before Web Reports will work.
This can be added under VPIM/SMTP, or from the Company > General page.
|
Hint: Depending upon how your servers are setup, it may be necessary to configure Smarthost. Consult with your administrator. |
Before you can generate a report, you must log in.
|
Note: Use Google Chrome for best results. Other web browsers may not be fully supported or provide access to all features. |
To log in:
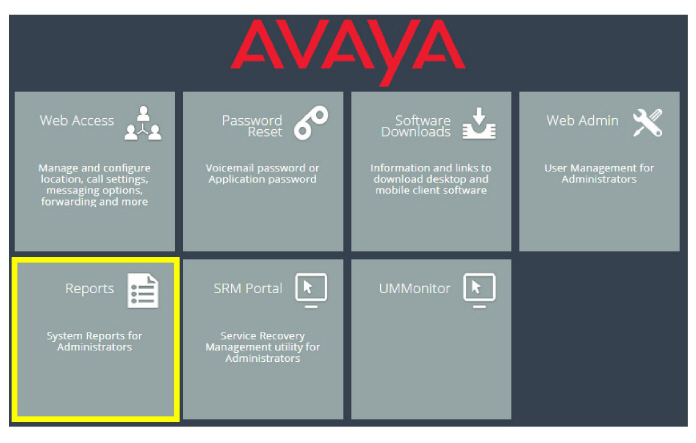
1.In a web browser, enter the IP address or hostname of the UC server (i.e. user.yourcompany.com or
https://192.168.1.10 or https://localhost) and hit Enter. The following screen appears. Click Reports.
|
Hint: If you do not know the IP address or the server name, contact your network administrator. |
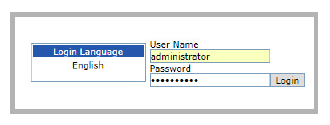
2.The login screen appears. Enter the administrator credentials for User Name and Password, then click Login.
3.The Web Reports main page appears.
The Web Reports feature includes some of pre-made templates. These are listed in the left-hand pane.
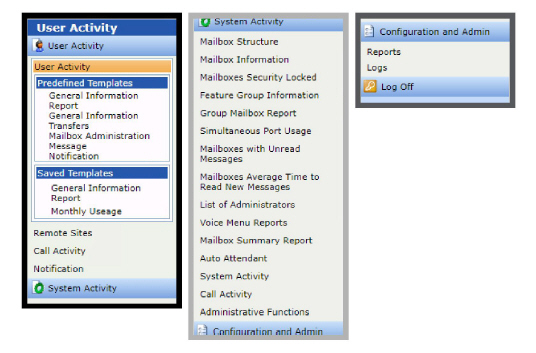
For most of these, you must specify the parameters (i.e. which company, mailboxes, etc.) to include in the report.
Many of these templates can be saved and reused.
Additional reports can be created as necessary (see Creating New Reports).
|
Hint: Due to the large number of report parameters available, templates should be created that focus on specific areas. Once saved, these can be run as required, or scheduled to run automatically. |
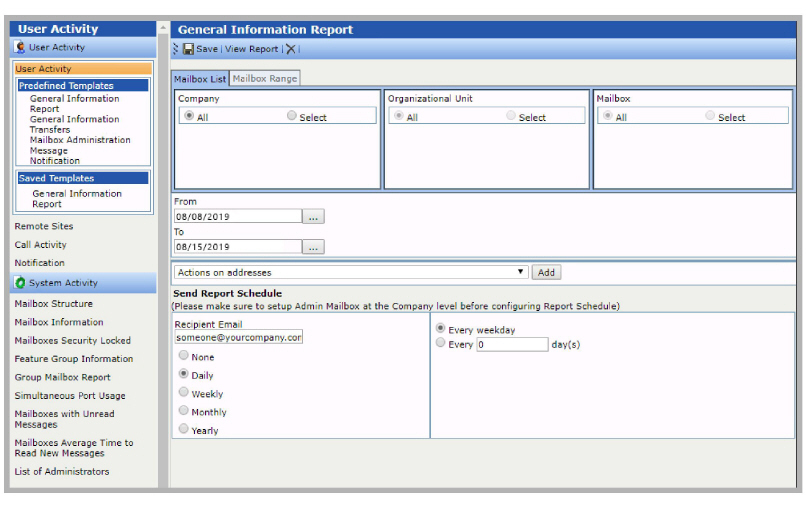
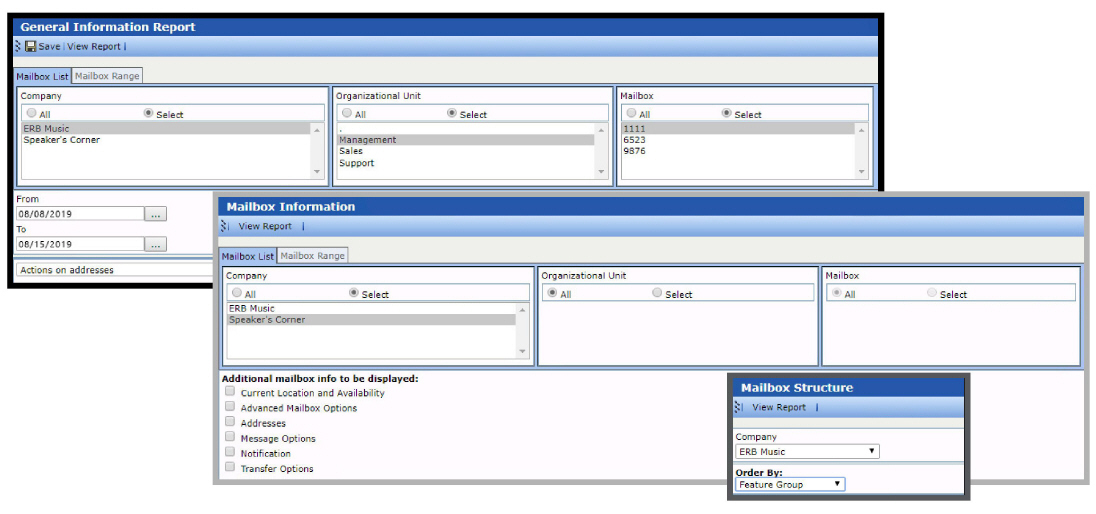
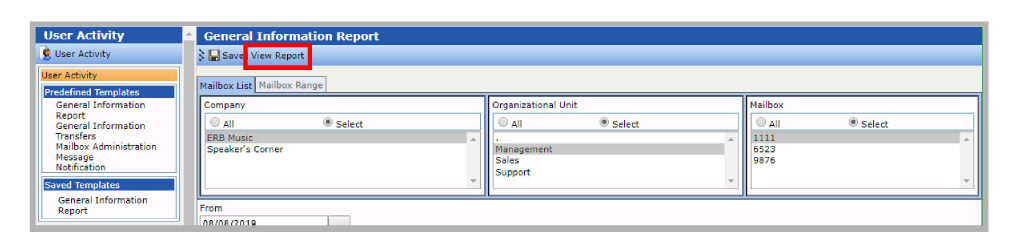
When you click a report in the left-hand pane, the following screen appears.
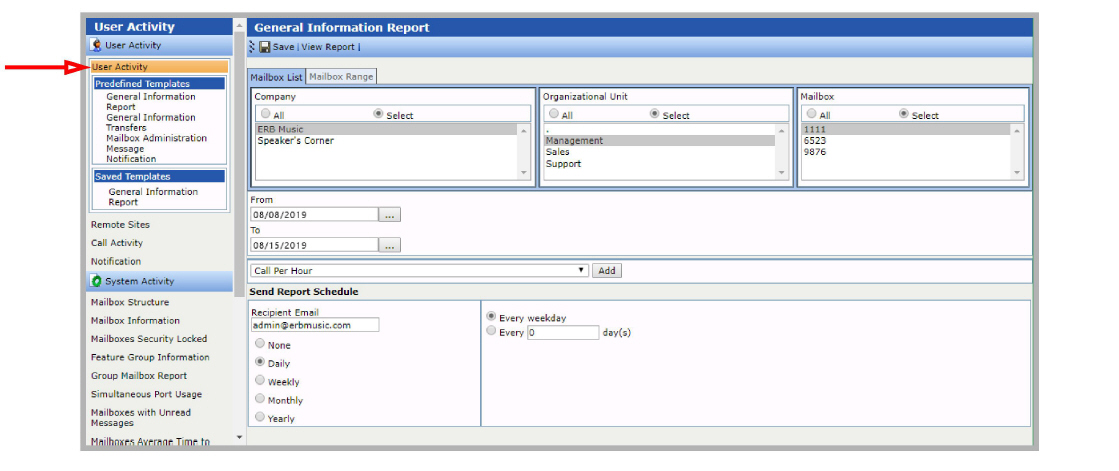
All report screens contain a number of useful, predefined templates. By making changes to these templates and saving them, reports can be created to meet almost any requirement.
1.Highlight User Activity (or another heading in the left-hand pane). The User Report screen appears.
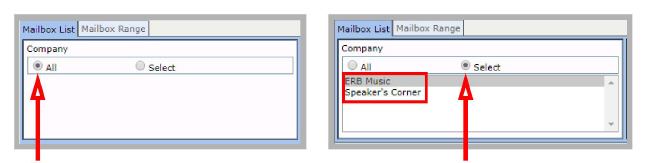
2.On the Mailbox List tab, pick the Company (if more than one are present) to generate the report for.
Enable All to include every company, or enable Select to pick one.
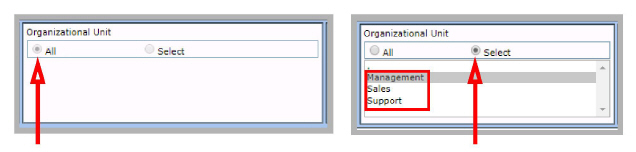
3.Choose the Organizational Unit for the report.
Enable All to include every OU under the chosen company, or enable Select to pick.
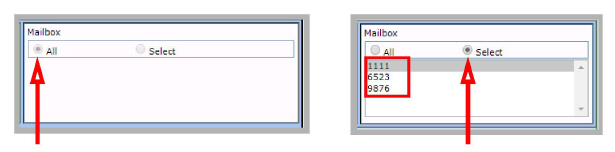
4.Specify which mailboxes to include in the report.
Enable All to include all mailboxes, or enable Select to pick.
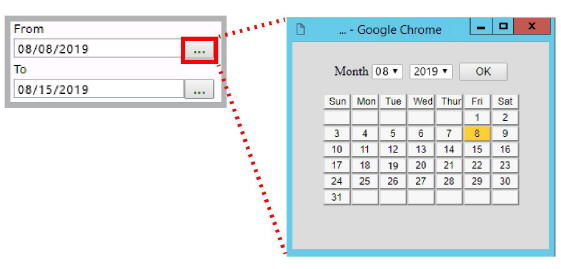
5.Choose the date range that the report will cover in the From and To fields. Click the ![]() to open a calendar to select the dates.
to open a calendar to select the dates.
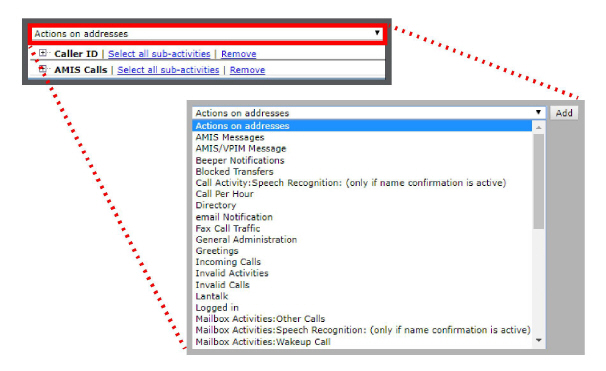
6.Add the parameters that are to be included in the report. Select a parameter from the dropdown list and click Add. Repeat this step to add all desired parameters.
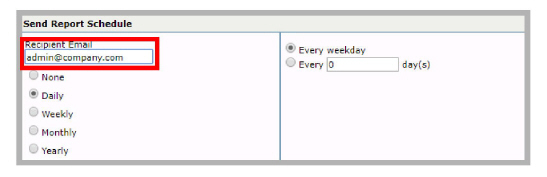
7.Optionally, you choose to generate the reports on a set schedule. The reports will be emailed to the selected people. Choose the schedule for the system to generate this report (e.g. every day, every 3 weeks on a Monday, etc.).
Specify one or more email addresses where the report is to be sent. Separate multiple addresses using a comma
(i.e. [email protected] , [email protected]).
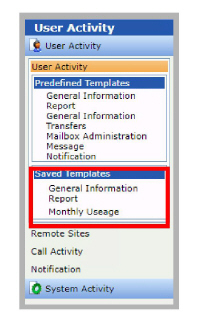
8.Click Save. The New Template dialog box appears.
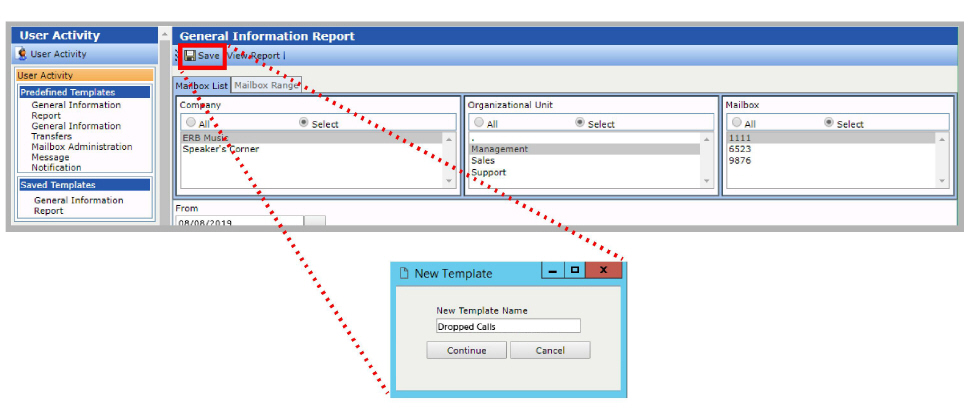
9.In the New Template Name field, enter a meaningful name for this report and click Continue.
The new template is displayed in the left-hand pane, under Saved Templates. To edit an existing template, click on its name in the list.
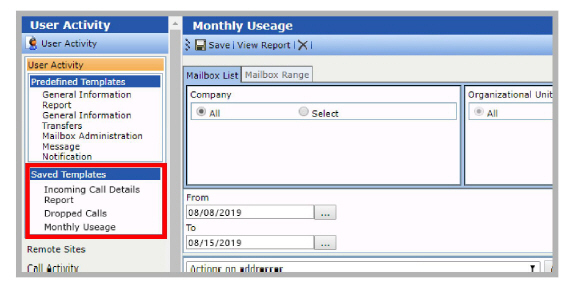
Select the report to view in the left-hand pane. Choose either a pre-defined report, or one that you have previously saved.
When prompted, enter the parameters for the report and then click the View Report button.
The report is generated and displayed on the screen.
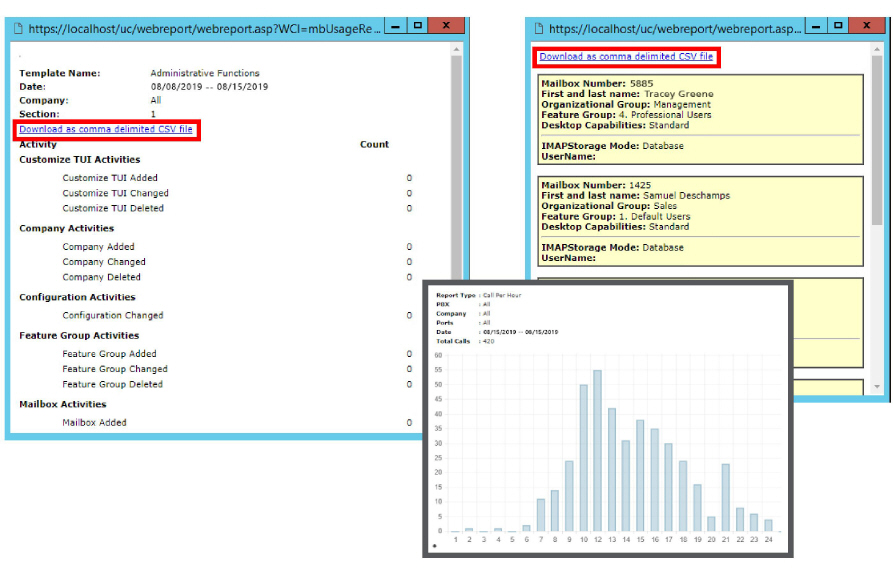
Some reports provide the option to download the data to a CSV file on your computer hard drive.
|
Note: Reports that are setup to be generated on a schedule and sent to an email address can still be viewed “live” in this manner. No emails will be generated by clicking View Reports. |
Use the following information to help interpret the output generated by Web Reports.
Duration - All time related values are in seconds unless otherwise noted.
|
Value |
Description |
|
0 |
Available |
|
1 |
Unavailable |
Availability
|
Value |
Description |
Notes |
|
0 |
All |
|
|
1 |
Mailbox |
|
|
2 |
AMIS |
|
|
3 |
VPIM |
|
|
4 |
|
|
|
5 |
Phone |
|
|
6 |
DL |
|
|
7 |
Beeper |
|
|
8 |
Voice Menu |
Voice menu with sub menu |
|
9 |
URL |
|
|
10 |
Fax |
|
|
11 |
Voice Submenu |
Submenu of current voice menu |
|
12 |
Contact |
|
|
13 |
SMS eMail |
|
|
14 |
Printer |
|
|
19 |
SMS Phone |
|
|
20 |
BBPIN |
|
|
21 |
Folder |
|
|
22 |
Google Docs |
|
|
23 |
Customized |
|
|
24 |
Storage |
|
|
Value |
Description |
|
0 |
None |
|
1 |
Personal External |
|
2 |
Busy External |
|
3 |
Name |
|
4 |
Location |
|
5 |
Personal Internal |
|
6 |
Busy Internal |
|
7 |
Unavailable Internal |
|
8 |
Unavailable External |
|
10 |
User Defined |
|
Value |
Description |
|
-1 |
All |
|
0 |
In Office |
|
1 |
At Lunch |
|
2 |
At Home |
|
3 |
In a Meeting |
|
4 |
Away on Business |
|
5 |
On Vacation |
|
6 |
Extended Absence |
|
7 |
Temporary Location |
|
8 |
Mobile |
|
9 |
Remote Office |
|
10 |
User Defined |